 Loading... Please wait...
-
Products
- Piezometers
- Inclinometers
- Strain Gauges
- Data Loggers
- Time Domain Reflectometry (TDR)
- Displacement Transducers
- Extensometers
- Settlement Sensors
- Pressure Cells
- Load Cells
- Tiltmeters · Pendulums
- Readouts
- Visualization Software
- Stressmeters
- Distributed Fiber Optic Sensors
- Temperature
- Instrumentation Cables
- DeAerators
- Vibration Monitoring
- Custom Instrumentation
- Discontinued
- Support
- Training
- Contact Us
- News
- Company
- Projects
- Resources
- Videos
- Links
Support
Tech Tips
General Tech Tips
Gauge Tech Tips
- Initial Zero Readings
- Troubleshooting with an Ohmmeter
- Unstable Readings
- VW Piezometers FAQ
- Applications for Vented Piezometers
- Specific Gravity Corrections for a Vibrating Wire Piezometer in Saltwater
- Batch Calibrated vs Individually Calibrated Strain Gauges
- Cable Shielding and Grounding
- Grouting for Piezometer and Inclinometer Installations
GeoNet Tech Tips
Readout Tech Tips
Software
Technical Support Checklist
To help expedite the troubleshooting process, please gather the following information, if possible, before contacting Technical Support:
- The Model and Serial Number of the malfunctioning equipment and any other equipment used in conjunction with it (e.g. sensor, readout, datalogger, etc.)
- Date the equipment was installed
- Date the issue arose
- What software program is being used to view the data?
- Have any splices or repairs been performed on the cable? If yes, what type?
- Do the factory zero readings closely match the field zero readings?
- Are other gauges installed in the same borehole or connected to the same datalogger? If yes, are those gauges functioning correctly?
- Has the faulty gauge been tested using another readout or datalogger?
- Are there any sources of electrical noise near the instrument or cable (e.g., generators, pumps, high-power utility lines, etc.)?
- Take pictures of the installation, including the wiring inside the datalogger or readout.
Multi-Point Borehole Extensometer Design Considerations
The design process of a Multi-Point Borehole Extensometer (MPBX) can be complex. Many critical details must be taken into account to ensure the design is successful. Several factors can influence the design, including borehole diameter, subsurface material, anchor type, range of movement, measurement points, and head assembly location.
Borehole Diameter
- The borehole must be large enough to accommodate the head assembly collar and standpipe (if used), especially if the head will be recessed.
- Some anchor types have specific minimum and maximum borehole size tolerances.
- If the extensometer will be installed through an auger or within a cased borehole, the casing or auger’s inside diameter must also be considered.
Subsurface Material
- The subsurface material of the borehole will directly impact the anchor type and the expected range of movement.
- The measurement zones (anchor locations) are determined by understanding subsurface conditions.
- In some cases, the appropriate anchor depths are identified in the field after drilling the borehole or access hole.
- If the material is compressible and large displacements are expected, it may be necessary to include slip couplings in line with the rod sheathing, especially with rigid PVC tubing.
Anchor Type
- The type of anchors used should be considered based on the orientation of the borehole and the type of subsurface material expected.
- Borros anchors are best suited for soft, compressible soil.
- Groutable anchors, constructed from steel reinforcing bar lengths, are the preferred option for installation in downward-directed boreholes easily filled with cement grout.
- Hydraulic bladder anchors can be installed in boreholes oriented in any direction, so long as the subsurface material is competent rock. They are particularly beneficial in boreholes that are fractured, oriented upwards, or challenging to grout.
Range of Movement
- The range of movement impacts the height of the head assembly.
- This is especially true for extensometers utilizing electrical displacement transducers, which may require a head assembly height of 0.5 to 1 m (2 to 3 feet).
- Rigid PVC tubing can accommodate some elongation or compression; however, when a large amount of displacement is expected, it is best to incorporate a slip coupler to reduce the potential for damage to the tubing.
Measurement Points
- The deepest anchor typically serves as the fixed datum point for the extensometer system and should be located in soil or rock that will not be deforming or displaced.
- If the application does not allow the deepest anchor to act as the reference point (e.g., tunnel or underground opening below installation), the head assembly can be used instead.
- When the head assembly is used, it must be surveyed periodically to establish an absolute point of reference.
- The number of anchor points often influences the head assembly collar and standpipe size and whether it will be read manually or with electrical displacement transducers (or a combination thereof).
Head Assembly Location
- Where clearance is not an issue, the head assembly can protrude from the borehole.
- Protruding head assemblies need to be protected from mechanical damage.
- Protection from temperature fluctuations is also needed if they contain displacement transducers, which are susceptible to temperature effects.
- If there isn’t enough clearance for the head assembly to protrude, it must be recessed below ground level.
- In some cases, the head can be lowered completely into the borehole.
- If this is not possible, an over-core will be required to recess the head. Over-coring can offer more space to work when it is time to install the transducer mount and transducers. It can also accommodate large collar hardware such as a flange.
- For deep-recessed installations, special tools may be needed to reach the tube mount for installation and adjustment of the transducers.
For more information about Multi-Point Borehole Extensometer design, refer to the Model 1100 instruction manual or contact GEOKON.
The Importance of Initial Zero Readings
Initial zero readings are very important in helping ensure improved accuracy with your measurements.
An initial zero reading establishes a baseline measurement, from which all subsequent data values are calculated.
In general, the initial zero reading is obtained by taking a measurement of the instrument on-site, prior to installation. Use of this field zero reading, instead of using the factory zero reading, will improve the accuracy of your calculated data values. On-site zero readings should closely coincide with the factory zero reading provided on the instrument’s calibration report (after any necessary temperature and barometric pressure corrections have been made). There are several different ways of taking an initial zero reading, and the exact steps involved vary by instrument. Consult the instruction manual provided with the instrument for specific instructions.
Troubleshooting Vibrating Wire Gauges with an Ohmmeter
Has the reading from a GEOKON vibrating wire instrument become unstable?
Has the instrument stopped working altogether?
This may be a sign that the cable has been broken, cut, or crushed. A quick and easy way to determine if the cable has been damaged is to use an ohmmeter to measure the resistance between the gauge leads. The expected resistance for the various wire combinations can be found on the VW Sensor Resistance Worksheet.
- If the resistance is very high (>1 megohm) or infinite, the cable is probably broken or cut.
- If the resistance is much lower than the gauge resistance specified in the instruction manual, the gauge conductors may be shorted.
Cable resistance should be taken into account, especially for long cables. Cable resistance for 22 AWG wire is approximately 14.7Ω per 1000 ft.(48.5Ω per km). Multiply this factor by two to account for both directions.
The internal thermistor can be checked in a similar manner by connecting the thermistor leads of the instrument to the ohmmeter. Standard thermistors have a resistance of 3,000Ω at 25 °C. High temperature thermistors have a resistance of 10,000Ω at 25 °C. For other temperatures, consult the thermistor resistance to temperature conversion tables in the instruction manual.
Unstable Gauge Readings
A constantly fluctuating vibrating wire reading may be caused by electrical interference.
Common sources of electrical interference include, generators, motors, arc welding equipment, high voltage lines, etc. If possible, move the instrument cable away from power lines and electrical equipment or install electronic filtering.
Another common cause of reading instability is a misconnection between the instrument conductors and the readout/datalogger, or incorrect readout/datalogger settings. Consult the instruction manual provided with the instrument to verify that all gauge conductors have been properly connected, and that the readout or datalogger has been set up correctly for the type of gauge being read. (If using a datalogger to record readings automatically, make sure the swept frequency excitation settings are correct.)
If the above suggestions do not correct the problem, the readout or datalogger may be malfunctioning. Try connecting a different gauge to see if the problem persists.
VW Piezometers FAQ
How do I choose the appropriate pressure range?
When selecting piezometer ranges, you should consider the pressure resulting from the height of water above it (approximately 1 psi per 2.3 ft. of water/1 kPa per 0.10 m of water) as well as the pressure resulting from any grout that will be placed over it (approximately 1.7× the weight of water). Excessive pressure can potentially over-range and damage the sensor and should be avoided. If grout pressure exceeds the pressure range of the piezometer, stage grouting can be considered, or a piezometer with a higher pressure range can be used (being mindful of the corresponding loss in sensitivity).
How “rugged” are VW piezometers?
VW piezometers are very reliable and have been shown to perform well over extended periods of time, even in harsh environments. The sensors are rugged and capable of withstanding nominal shock loads; their signals can be transmitted via cables over long distances (2 km+) without degradation.
What if I over-range the piezometer?
VW piezometers can withstand certain amounts of over-ranging. The magnitude ultimately depends on the piezometer type, but as a rule of thumb, over-ranging should not exceed 150% of the specified range. Beyond 100% of full-scale range, there can be a slight loss in accuracy, but permanent damage is rare below 150%. If in doubt, contact the factory.
How do I know if a piezometer is reading correctly?
To test if a piezometer is working correctly (after a shock impact, for instance), perform an on-site spot check to verify that the zero reading aligns with the factory zero reading. If the on-site zero reading—after corrections for temperature, barometric pressure, and elevation are made—falls within approximately 50 “digits” (1 digit = frequency squared/1000) of the factory zero reading, then the piezometer can be considered to be working correctly. If the reading is off by more than 60 digits, the sensor may still perform correctly; however, the factory should be contacted for further guidance.
How can I protect the piezometer from freezing?
Foam plug inserts installed in piezometer tips can significantly reduce the potential for ice damage in freezing conditions (contact the factory for further details).
Applications for Vented Piezometers
As a rule, piezometers that are sealed inside a borehole with bentonite grout or pellets do not need to be vented. The purpose of the vent line is to compensate for barometric fluctuations.
In most cases, barometric pressure changes at the ground surface will never reach a sealed piezometer. It is better to use the non-vented type and, if necessary, record the barometric pressures by some other means. The Barometric pressure is then compared to the piezometer pressure data for correlation between the two. Correlation is normally observed, but the barometric changes seen by the piezometer are nearly always attenuated and, in many cases, suffer a time lag. The compensation, therefore, can be quite complicated.
On the other hand, applications such as open holes, standpipes, wells, etc., where the water surface is in direct contact with the air above, are good candidates for the use of vented piezometers.
Specific Gravity Corrections for a Vibrating Wire Piezometer in Saltwater
Saltwater has a higher density (weight) than freshwater, therefore it exerts more pressure on the vibrating wire piezometer than freshwater. This increased pressure will yield incorrect results if the reading is not adjusted for the specific gravity of saltwater.
The specific gravity of freshwater and saltwater are as follows:
Specific gravity of fresh water = 1
Specific gravity of saltwater = 1.025
Note: The specific gravity of saltwater is the ratio of saltwater/freshwater ![]()
GEOKON calibration sheets typically give kPa/digit and psi/digit gauge factors.
To correct for the specific gravity of salt water, the kPa/psi reading is converted to the desired engineering unit (e.g., feet or meters of water), then divided by the specific gravity of saltwater.
The example below uses a psi gauge factor and an engineering unit of feet of water (PSI to FT = multiplier of 2.31).
Freshwater @50psi measured = (50psi x 2.31) / 1 = 115.5 ft (head of water)
Saltwater @50psi measured = (50psi x 2.31) / 1.025 = 112.68 ft (head of water)
In the above example, the reading provided by the piezometer would show 115.5 feet; however, once the calculations are performed using the specific gravity of saltwater, the actual head of water is determined to be 112.68 feet.
This conversion could be performed at the gauge factor level, but the weight of the material per cubic foot would need to be known. It is easier to take a specific gravity measurement of the liquid and perform corrections at the pressure level.
Batch Calibrated vs Individually Calibrated Strain Gauges
Standard GEOKON strain gauges are batch calibrated.
A controlled number of sample gauges from each production batch are tested for accuracy, linearity, and repeatability. These samples are used to derive an average gauge factor for the entire batch. The accuracy of this method is ±0.5% of the full-scale reading, which is sufficient for most applications. A batch calibration report with easy-to-implement calculations is provided with each order.
For applications where the maximum accuracy is desired, strain gauges can be individually calibrated.
Each gauge is tested for accuracy, linearity, and repeatability in a controlled laboratory setting. This method precisely characterizes the relationship between applied strain and gauge output. Individually calibrated strain gauges have an accuracy of ±0.1% of the full-scale reading. A calibration report with detailed test results and gauge-specific linear and polynomial equations is provided for each gauge.
Cable Shielding and Grounding
The GEOKON vibrating wire (VW) transducer is typically excited with a 5Vpk square wave, and the return VW signal is a sine wave in the millivolt range.
Because the excitation signal is rich in harmonics (extending into the radio frequency spectrum), and the return VW signal is both low amplitude and feeds directly into a single-ended high impedance input, electromagnetic noise may easily escape from or be coupled into the transducer cable. Therefore, high quality shielded cable shielding is essential.
When excitation occurs, an unshielded (or poorly shielded) cable can broadcast RF harmonics and interfere with proper operation of neighboring equipment.
In addition, with an unshielded (or poorly shielded) cable, the VW signal returning from the transducer may be corrupted by noise sources. Some of these noise sources include pump motor drives (especially PWM or PFM), fluorescent lighting, lightning, 50-60Hz wiring, radio transmission and industrial equipment. In a similar fashion, the thermistor signal returned from each VW transducer is susceptible to these same noise sources.
The figure below shows the ideal wiring scheme for a GEOKON VW transducer. Note that the shield drain wire is connected at point S (this is the same as connection S on the GEOKON 4999 series Terminal Boxes). It is important that all shield drain wires are connected to their respective S connections in order for proper grounding (and therefore noise reduction) to be effective. Note also that the shield is isolated from Earth Ground. This is important to prevent an electrical “ground-loop” from occurring should the insulation of the cable break down.
Grouting for Piezometer and Inclinometer Installations
Grouting serves two distinct purposes in geotechnical instrumentation: sealing piezometers within a borehole to measure pore pressure, and backfilling boreholes around inclinometer casings to ensure accurate deformation monitoring.
In both applications, grout is typically an engineered mix of powdered bentonite, cement, and water — but the criteria for selecting the right mix differ significantly depending on the instrument and the site conditions.
Fully Grouted Method (FGM) for Vibrating Wire Piezometers
The fully grouted method eliminates the need for traditional sand filter packs and bentonite seals by embedding the piezometer directly within a continuous grout column. This simplifies installation and enables multiple sensors to be installed in a single borehole.
The critical design parameter for FGM is permeability compatibility between the grout and the surrounding formation. For the piezometer to respond accurately to pore pressure changes in the formation, the grout must not act as a hydraulic barrier nor as a preferential drainage path. Current literature recommends that grout permeability should be no more than 10 to 100 times the permeability of the surrounding formation, depending on the application and acceptable response time.
To achieve this, the grout must be:
- Stable — resistant to bleed water separation and syneresis after placement
- Low permeability — matched to the hydraulic conductivity of the formation
- Non-shrinking and non-cracking — to maintain a continuous, sealed contact with the formation wall
Grout that is significantly more permeable than the surrounding formation can act as a hydraulic short-circuit within the borehole, causing the piezometer to under-read the true pore pressure — an effect that is most pronounced under transient conditions such as embankment construction over low-permeability clay, where errors are always unconservative.
Grout Selection for Inclinometer Casing Installation
For inclinometer casings, the governing design criterion shifts from permeability to stiffness compatibility. The grout must deform consistently with the surrounding soil or rock — if it is significantly stiffer or softer than the formation, it may not faithfully transmit shear movements to the casing, compromising the accuracy of lateral displacement measurements.
- Grout that is too stiff relative to the formation can bridge across deforming zones, masking the true extent and location of movement.
- Grout that is too soft may allow the casing to move independently of the surrounding material, introducing error into displacement profiles.
The grout mix should therefore be proportioned to approximate the shear modulus of the host material.
Site-Specific Mix Design
Grout mix selection cannot be generalized across sites or instrument types. Key site factors to evaluate include:
- Estimated formation permeability (for piezometer installations)
- Formation stiffness and expected deformation magnitude (for inclinometer installations)
Documenting the grout mix proportions, water-to-cement ratio, and placement method as part of the installation record is strongly recommended, as this information is essential for interpreting sensor response and troubleshooting anomalous readings.
Understanding GeoNet Mesh Radio Networks (Models 8800, 8901, 8903)
A GeoNet Network consists of a certain number of loggers and one gateway.
- Loggers:
- Collect data from sensors (piezometers, strain gauges, etc.)
- Forward the collected data to the gateway
- Relays data from/to other loggers as necessary to reach the gateway
- Gateway:
- Controls the network
- Central collection point for all data
GeoNet operates on a self-healing, mesh radio network.
To create the best radio environment possible, follow these guidelines:
- Always mount GeoNet devices so the antenna is pointing up.
- Create as much clear space around the antenna as possible and remove any nearby obstructions.
- A minimum mounting height of six-feet is recommended.
- Common mounting mistakes include:
- Not enough clear space around the antenna
- Mounting devices horizontally
- Placing the device inside an enclosure
- Metallic objects nearby
- Mounting on mesh fencing or surrounding the device with mesh fencing
GeoNet devices can only communicate with other devices that are set to the same radio channel and are within range of their radio signal.
- All GeoNet devices are set to operate on the same channel at the factory
- Channels only need to be configured if multiple networks will be operating within radio range of one another
GeoNet loggers can communicate with the gateway over greater distances, and work around obstacles, by using other loggers as repeaters.
- Each transmission from logger to logger, or from logger to gateway is known as a “Hop”
- Up to four hops can be made between a logger and the gateway
- The network will automatically find the ideal path between each logger and the gateway
There are two modes of network operation: Deployment mode and Normal mode.
- Deployment Mode:
- Allows Loggers to be quickly added to a network and verified
- Must be used when setting up a network or making changes to the network (adding Loggers, changing batteries, resetting a device, etc.)
- Indicated by the LEDs on the gateway flashing every 10-15 seconds
- Automatically activated when the gateway is powered on
- Active for 60 minutes by default (the deploy period can be changed using Agent software)
- Can be reactivated/reset by pressing the status button on the gateway (may take up to 3 minutes to take effect)
- Though deployment mode can be activated in Agent software, it is best practice to physically press the status button on the gateway
- Normal Mode:
- Less battery usage than Deployment mode
- Default mode of operation when not in Deployment mode
Troubleshooting GeoNet Mesh Networks (Models 8800, 8901, 8903)
No Power:
- Loggers and Local Gateways:
- Check the batteries to make sure they are properly installed
- Replace batteries if they are depleted
- Make sure the power switch is set to the correct battery type: lithium or alkaline
- Cellular Gateways:
- Make sure the AC adaptor or other external power source is connected correctly (Cellular Gateways must have an external power source)
- Make sure the power switch is set to “INT BATTERY” (the EXT BATTERY position is only used for subpolar climates: see the manual for more information)
Logger will not join the network:
- Make sure deployment mode is active (indicated by one or both of the LEDs on the gateway flashing every 10-15 seconds)
- Verify that channel dipswitches inside the logger are set to the same position as the switches inside the gateway
- Cycle the power on the logger while it is in close proximity to the gateway and see if it will join the network
- If a logger will not join the Network after the previous suggestions have been tried, it may be out of sync with the gateway and needs to be reset
- To reset a logger, hold down the status button until the red and green LEDs turn on, then release (NOTE: Press and hold the status button on the logger ONLY, do not do this on the gateway)
Weak radio signal (red and green LEDs flashing), or loss of radio signal when moving logger to its final location:
- Try to improve the radio signal by:
- Mounting the device as high as possible
- Making sure there is plenty of clear space around the antenna
- Removing obstructions from the radio path (clear line of sight is best)
- Moving the logger to a better location (splice additional cable onto the instrument if necessary)
- Adding more loggers to the network to provide alternate radio paths
- If the above suggestions do not correct the problem, a high-gain, directional antenna may be required: contact GEOKON for more information
Agent can’t connect to the Gateway:
- Cellular Gateways:
- Ensure that the gateway is connected to an external power supply and that the power switch is set correctly
- Verify the gateway is connected to the cellular network by pressing the status button and observing a green, or green and red flash on the LED indicators
- Make sure the token entered into Agent software is correct, and that the correct “Cloud Network” has been chosen
- Local Gateways:
- Ensure that the D batteries are properly installed
- Replace batteries if they are depleted
- Make sure the power switch is set to the correct battery type: lithium or alkaline
- Make sure the USB or RS-232 cable is securely connected to the gateway and the PC
- Make sure the address (COM port) entered into Agent software is correct
No Data from a Logger:
- Take a test reading by pressing the status button on the gateway (reading will be available for download within the next 6 minutes, depending on radio cycles and gateway type)
- If necessary, data can be retrieved directly from a logger by following these steps:
- Connect a PC to the USB port
- Create a new network in Agent software
- Enter the COM port the logger is connected to as the Network Address
- Download the data
Logger data is present (e.g., battery voltage or signal strength), but the Vibrating Wire or Thermistor Reading is Missing, Incorrect, or Unstable:
- Verify that the gauge leads are wired correctly (refer to the GeoNet instruction manual for wiring information)
- Multi-channel and addressable loggers stop trying to read empty channels after two attempts; additional attempts occur at the top of every hour (reset the logger to initiate an immediate retry)
- Move any sources of electrical noise away from the transducer cable (generators, motors, arc welding equipment, etc.)
- Check sensor operation with an independent readout, such as a GK-404 or GK-406
GK-404 Readout: Button Functionality
Use the Pos button to change the GK-404 pluck settings.
Each Position setting (A-F) has different preprogrammed parameters that are optimized for certain instruments. Each option also has different scaling and processing characteristics. The table below details the correct position to use with the various models sold by GEOKON.
Pressing the Mode button will select the format of the vibrating wire reading.
The available options are Dg (digits), Hz (hertz), μS (period), and με (microstrain). Only positions C, D, and E support the με microstrain format.
Position and Mode Functions
| Position | A | B | C | D | E | F |
|---|---|---|---|---|---|---|
| GEOKON Model Numbers › | All | 4300BX, 4300NX, 4400, 4500, 4600, 4700, 4800, 4900 | 4000 | 4200 | 4100 | 4300EX |
| Mode 1 › | Dg | µE | Dg | |||
| Units › | Digits | µStrain (ε) | Digits | |||
| Calculation › | F2 × 10-3 | F2 × 10-3 × 4.062 | F2 × 10-3 × 3.304 | F2 × 10-3 × 0.39102 | F2 × 10-3 | |
| Mode 2 › | Hz | |||||
| Units › | Hertz | |||||
| Calculation › | F = Frequency in Hertz | |||||
| Mode 3 › | µS | |||||
| Units › | µSec | |||||
| Calculation › | T = Period (1/F) in µSec | |||||
| Frequency Sweep: (Hz) › | 450-6000 | 1500-3500 | 450-1200 | 1500-3500 | 2500-6000 | |
Please Note: there is no number displayed on screen to indicate which mode the GK-404 is in. The current mode can be determined by observing the unit of measure the gauge reading is displayed in.
Pressing the Cfg button will cause the GK-404 to enter the Configuration Menu.
This menu includes settings for the backlight, contrast, and auto-off. The battery voltage can also be viewed. Use the Pos button to select the various parameters and the Mode button to select each parameter's options. Press Cfg twice at any time to exit the Configuration Menu.
Factory default settings can be restored at any time by pressing and holding the Cfg and Pos buttons when powering up the GK-404. The factory default settings are as follows:
- POSITION: B
- MODE: Dg
- BACKLIGHT: OFF
- CONTRAST: 50%
- POWER-OFF TIME: Five minutes
GK-406 Measurement Display Setup
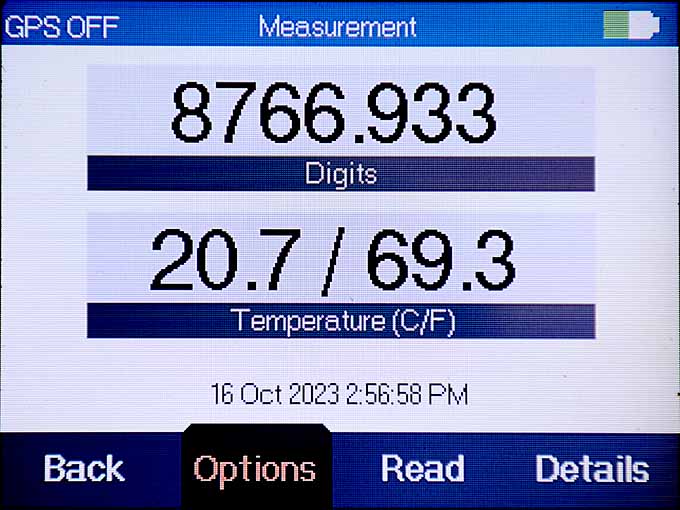
When reading a sensor, the GK-406 will display Digits and Temperature by default.
- From the main screen select Settings.
- Select Measure, and then Measurement Display.
- Select the two measurement types to display. The available measurement types are Frequency (Hz), Digits, B Units, Temperature (C/F), Thermistor (Ohms), and Engineering Units. Deselect the Hide Measurement Graph option to display a line graph of the sensor reading in addition to the numeric reading.
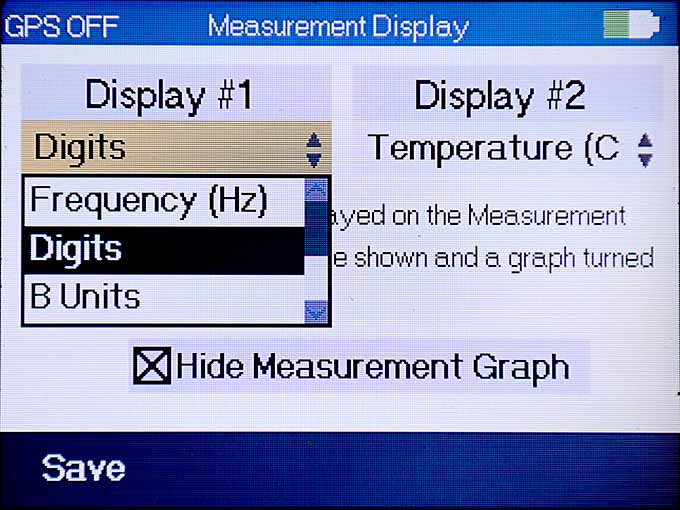
- When finished editing the display settings, select Save.
Additional Notes:
- When Engineering Units is selected, the GK-406 will display the calculated units based on the sensor and site selected and will utilize zero readings, gauge factors, and any unit conversions that have been applied. If a sensor or site has not been chosen, or if they are not set up correctly, Undeclared will be displayed.
- When Temperature is selected, the GK-406 will display the calculated temperature value based on the temperature sensor selected in the sensor menu. Failure to select the correct temperature sensor will result in incorrect coefficients being applied. (The GK-406 allows the user to add custom thermistor names and coefficients as needed.)
- The Thermistor (Ohms) setting can be useful in performing resistance readings on thermistors and vibrating wire leads. However, it cannot accurately measure shorts.
Please refer to the GK-406 instruction manual for additional information.
GK-406 Read Function
The Read function on the GK-406 allows the user to quickly take a reading. The reading is not stored, and the sensor settings must be set each time.
- From the main screen, select Read.
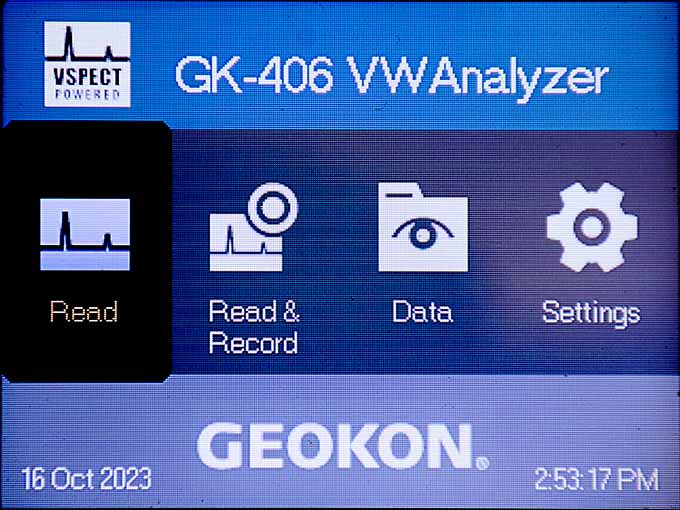
- An immediate reading will be taken. The GK-406 displays digits and temperature by default. Each time Read is selected, a new reading will be taken.
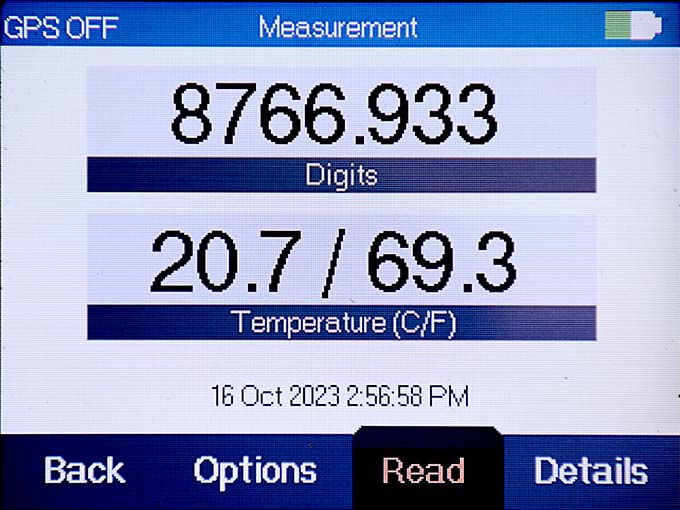
- To see additional information about the sensor response, select Details.
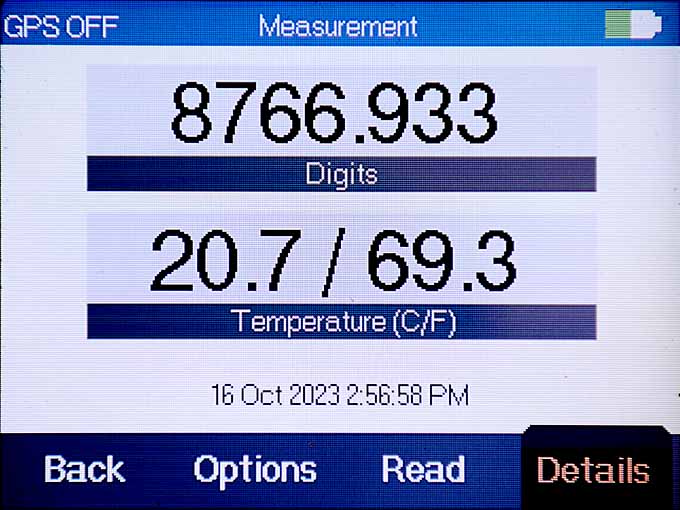
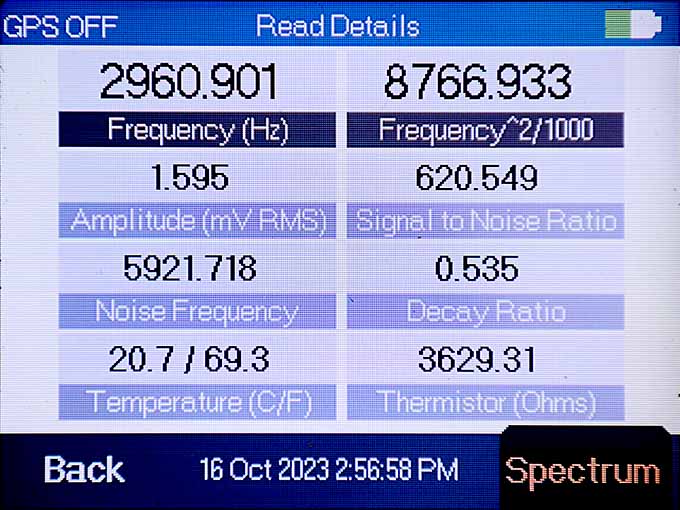
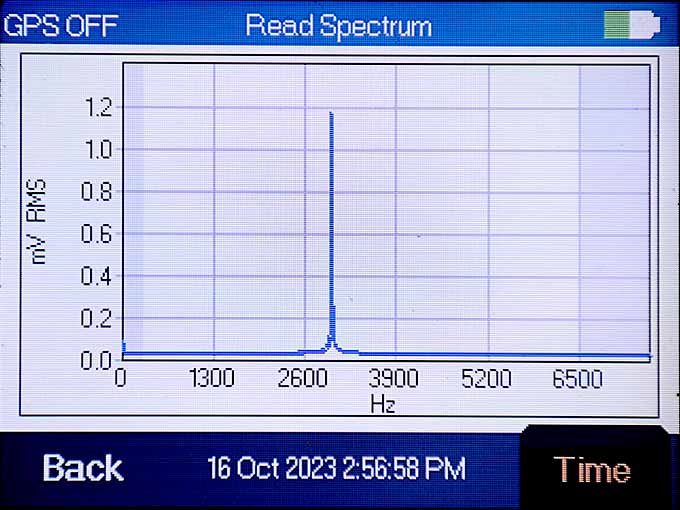
- Select Spectrum to display the response of the plucked gauge as a line graph. The graph will also display any noise that may be present in the frequency range. (The frequency sweep is shown in white; blue denotes the area outside the selected range.)
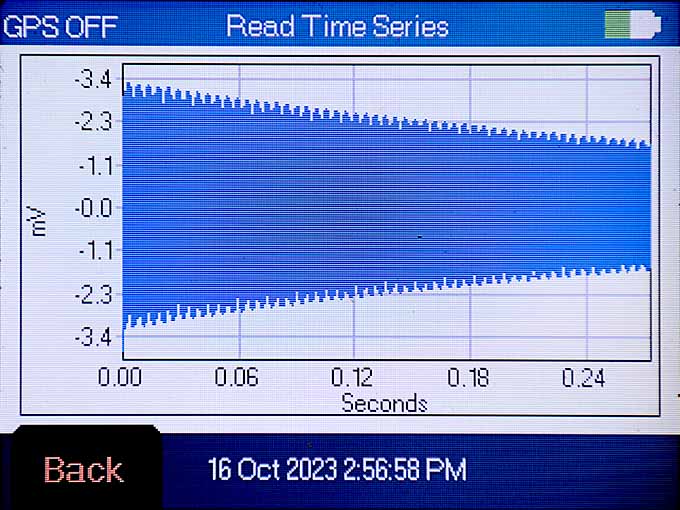
- Select Time to display a time series graph of the signal response decay.
- To make changes to the sensor settings, return to the Read screen and select Options.
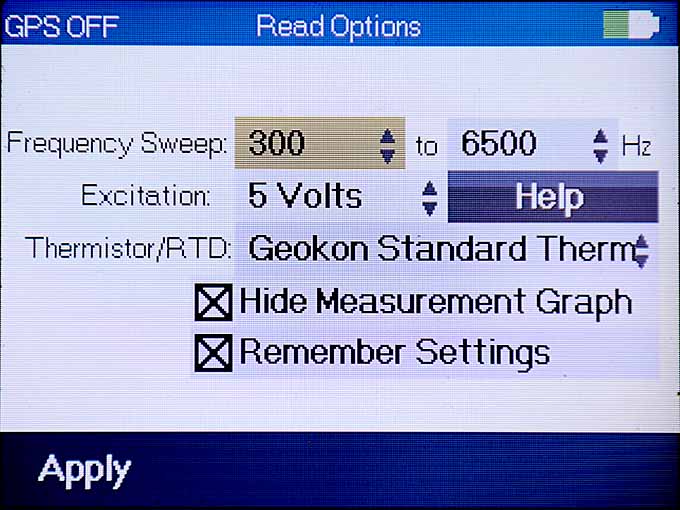
Available Options:
- Frequency Sweep: Select the values that correspond to the connected sensor. The frequency range of GEOKON sensors are provided in the sensor instruction manual.
- Excitation: Excitation should be set to 5 volts for most GEOKON sensors. (Use 12 volts for GEOKON Model 4500HT gauges.) If unsure, consult the product manual or contact the factory.
- Thermistor/RTD: Select whether the thermistor is GEOKON standard, GEOKON high temp, or from another manufacturer. (The GK-406 also allows the user to add custom thermistor names and coefficients as needed. Refer to the GK-406 instruction manual for more information.)
- Hide Measurement Graph: Deselect to display a line graph of the sensor reading in addition to the numeric reading.
- Remember Settings: Check to have the GK-406 save the current settings and apply them the next time the Read function is used.
- Select Apply to close the options screen and take a new reading with the updated settings.
Please refer to the GK-406 instruction manual for additional information.
USB Drivers
A USB driver is a file that allows GEOKON dataloggers, readouts, and other hardware devices to communicate with the operating system of a computer.
Installing USB drivers is an essential part of the setup process; if they are not installed correctly the device will not work.
USB drivers for GEOKON devices can be downloaded from www.geokon.com/software. If you have installed the USB drivers but they are not working, the drivers will need to be reinstalled as follows:
- Right click on the CDM.zip folder and then select Extract All…”
- A new window will open. Select a location for the file and then click “Extract”.
- Locate the extracted CDM file. Right click on the file and then select “Run as Administrator”.
If the USB drivers still don’t work after installing them in this manner, please contact your IT department.
Agent compared to Third-Party Data Acquisiton Software
| Agent | Third-Party Software | |
|---|---|---|
 GEOKON Agent is a basic data collection and visualization software that makes the tasks of configuring hardware, monitoring sensors, collecting data, managing data files, and applying corrections easier and faster.
 |
Agent compared to Third-Party Data Acquisiton Software: |
 Industry-leading data visualization software platforms have dozens of visualization and analysis tools to help the user understand complex data and make informed decisions.
 |
| Data Acquisition | ||
| X | Automatic Data Collection | X |
| Edit/Recalibrate Logged Data | X | |
| Add Manually Taken Readings | X | |
| Remove Data Noise by eliminating random disturbance in sensor readings | X | |
| X | Export Data Files | X |
| X | Populate Calibration Factors Automatically from GEOKON calibration database (Not available for all sensors) | |
| X | Converts Raw Data to Engineering Units | X |
| X | Perform Powerful Math Calculations | X |
| Visualization and Analysis | ||
| X | Display Numerical Data in Versatile Tables | X |
| X | Customizable Trendline Graphs | X |
| Custom Dashboards | X | |
| Overlay real-time data on an image, webcam, or GIS map | X | |
| Contour Plotting displays measurement distribution over a given location | X | |
| Over 30 Visualizations and Analysis Tools | X | |
| Reports, Alerts, and Collaboration | ||
| Create, Design, and Schedule Reports for daily, weekly, or monthly delivery | X | |
| X | Visual and Audio Alarms for out of rangedata and sensor malfunction | X |
| Manage Stakeholder Access to Features and Data with fine-grained user roles | X | |
| Customizable Interface and Login Page can display user’s brand logo and colors | X | |
General Tech Tips
Gauge Tech Tips
GeoNet Tech Tips
Readout Tech Tips
Software
Technical Support Checklist
To help expedite the troubleshooting process, please gather the following information, if possible, before contacting Technical Support:
- The Model and Serial Number of the malfunctioning equipment and any other equipment used in conjunction with it (e.g. sensor, readout, datalogger, etc.)
- Date the equipment was installed
- Date the issue arose
- What software program is being used to view the data?
- Have any splices or repairs been performed on the cable? If yes, what type?
- Do the factory zero readings closely match the field zero readings?
- Are other gauges installed in the same borehole or connected to the same datalogger? If yes, are those gauges functioning correctly?
- Has the faulty gauge been tested using another readout or datalogger?
- Are there any sources of electrical noise near the instrument or cable (e.g., generators, pumps, high-power utility lines, etc.)?
- Take pictures of the installation, including the wiring inside the datalogger or readout.
Multi-Point Borehole Extensometer Design Considerations
The design process of a Multi-Point Borehole Extensometer (MPBX) can be complex. Many critical details must be taken into account to ensure the design is successful. Several factors can influence the design, including borehole diameter, subsurface material, anchor type, range of movement, measurement points, and head assembly location.
Borehole Diameter
- The borehole must be large enough to accommodate the head assembly collar and standpipe (if used), especially if the head will be recessed.
- Some anchor types have specific minimum and maximum borehole size tolerances.
- If the extensometer will be installed through an auger or within a cased borehole, the casing or auger’s inside diameter must also be considered.
Subsurface Material
- The subsurface material of the borehole will directly impact the anchor type and the expected range of movement.
- The measurement zones (anchor locations) are determined by understanding subsurface conditions.
- In some cases, the appropriate anchor depths are identified in the field after drilling the borehole or access hole.
- If the material is compressible and large displacements are expected, it may be necessary to include slip couplings in line with the rod sheathing, especially with rigid PVC tubing.
Anchor Type
- The type of anchors used should be considered based on the orientation of the borehole and the type of subsurface material expected.
- Borros anchors are best suited for soft, compressible soil.
- Groutable anchors, constructed from steel reinforcing bar lengths, are the preferred option for installation in downward-directed boreholes easily filled with cement grout.
- Hydraulic bladder anchors can be installed in boreholes oriented in any direction, so long as the subsurface material is competent rock. They are particularly beneficial in boreholes that are fractured, oriented upwards, or challenging to grout.
Range of Movement
- The range of movement impacts the height of the head assembly.
- This is especially true for extensometers utilizing electrical displacement transducers, which may require a head assembly height of 0.5 to 1 m (2 to 3 feet).
- Rigid PVC tubing can accommodate some elongation or compression; however, when a large amount of displacement is expected, it is best to incorporate a slip coupler to reduce the potential for damage to the tubing.
Measurement Points
- The deepest anchor typically serves as the fixed datum point for the extensometer system and should be located in soil or rock that will not be deforming or displaced.
- If the application does not allow the deepest anchor to act as the reference point (e.g., tunnel or underground opening below installation), the head assembly can be used instead.
- When the head assembly is used, it must be surveyed periodically to establish an absolute point of reference.
- The number of anchor points often influences the head assembly collar and standpipe size and whether it will be read manually or with electrical displacement transducers (or a combination thereof).
Head Assembly Location
- Where clearance is not an issue, the head assembly can protrude from the borehole.
- Protruding head assemblies need to be protected from mechanical damage.
- Protection from temperature fluctuations is also needed if they contain displacement transducers, which are susceptible to temperature effects.
- If there isn’t enough clearance for the head assembly to protrude, it must be recessed below ground level.
- In some cases, the head can be lowered completely into the borehole.
- If this is not possible, an over-core will be required to recess the head. Over-coring can offer more space to work when it is time to install the transducer mount and transducers. It can also accommodate large collar hardware such as a flange.
- For deep-recessed installations, special tools may be needed to reach the tube mount for installation and adjustment of the transducers.
For more information about Multi-Point Borehole Extensometer design, refer to the Model 1100 instruction manual or contact GEOKON.
The Importance of Initial Zero Readings
Initial zero readings are very important in helping ensure improved accuracy with your measurements.
An initial zero reading establishes a baseline measurement, from which all subsequent data values are calculated.
In general, the initial zero reading is obtained by taking a measurement of the instrument on-site, prior to installation. Use of this field zero reading, instead of using the factory zero reading, will improve the accuracy of your calculated data values. On-site zero readings should closely coincide with the factory zero reading provided on the instrument’s calibration report (after any necessary temperature and barometric pressure corrections have been made). There are several different ways of taking an initial zero reading, and the exact steps involved vary by instrument. Consult the instruction manual provided with the instrument for specific instructions.
Troubleshooting Vibrating Wire Gauges with an Ohmmeter
Has the reading from a GEOKON vibrating wire instrument become unstable?
Has the instrument stopped working altogether?
This may be a sign that the cable has been broken, cut, or crushed. A quick and easy way to determine if the cable has been damaged is to use an ohmmeter to measure the resistance between the gauge leads. The expected resistance for the various wire combinations can be found on the VW Sensor Resistance Worksheet.
- If the resistance is very high (>1 megohm) or infinite, the cable is probably broken or cut.
- If the resistance is much lower than the gauge resistance specified in the instruction manual, the gauge conductors may be shorted.
Cable resistance should be taken into account, especially for long cables. Cable resistance for 22 AWG wire is approximately 14.7Ω per 1000 ft.(48.5Ω per km). Multiply this factor by two to account for both directions.
The internal thermistor can be checked in a similar manner by connecting the thermistor leads of the instrument to the ohmmeter. Standard thermistors have a resistance of 3,000Ω at 25 °C. High temperature thermistors have a resistance of 10,000Ω at 25 °C. For other temperatures, consult the thermistor resistance to temperature conversion tables in the instruction manual.
Unstable Gauge Readings
A constantly fluctuating vibrating wire reading may be caused by electrical interference.
Common sources of electrical interference include, generators, motors, arc welding equipment, high voltage lines, etc. If possible, move the instrument cable away from power lines and electrical equipment or install electronic filtering.
Another common cause of reading instability is a misconnection between the instrument conductors and the readout/datalogger, or incorrect readout/datalogger settings. Consult the instruction manual provided with the instrument to verify that all gauge conductors have been properly connected, and that the readout or datalogger has been set up correctly for the type of gauge being read. (If using a datalogger to record readings automatically, make sure the swept frequency excitation settings are correct.)
If the above suggestions do not correct the problem, the readout or datalogger may be malfunctioning. Try connecting a different gauge to see if the problem persists.
VW Piezometers FAQ
How do I choose the appropriate pressure range?
When selecting piezometer ranges, you should consider the pressure resulting from the height of water above it (approximately 1 psi per 2.3 ft. of water/1 kPa per 0.10 m of water) as well as the pressure resulting from any grout that will be placed over it (approximately 1.7× the weight of water). Excessive pressure can potentially over-range and damage the sensor and should be avoided. If grout pressure exceeds the pressure range of the piezometer, stage grouting can be considered, or a piezometer with a higher pressure range can be used (being mindful of the corresponding loss in sensitivity).
How “rugged” are VW piezometers?
VW piezometers are very reliable and have been shown to perform well over extended periods of time, even in harsh environments. The sensors are rugged and capable of withstanding nominal shock loads; their signals can be transmitted via cables over long distances (2 km+) without degradation.
What if I over-range the piezometer?
VW piezometers can withstand certain amounts of over-ranging. The magnitude ultimately depends on the piezometer type, but as a rule of thumb, over-ranging should not exceed 150% of the specified range. Beyond 100% of full-scale range, there can be a slight loss in accuracy, but permanent damage is rare below 150%. If in doubt, contact the factory.
How do I know if a piezometer is reading correctly?
To test if a piezometer is working correctly (after a shock impact, for instance), perform an on-site spot check to verify that the zero reading aligns with the factory zero reading. If the on-site zero reading—after corrections for temperature, barometric pressure, and elevation are made—falls within approximately 50 “digits” (1 digit = frequency squared/1000) of the factory zero reading, then the piezometer can be considered to be working correctly. If the reading is off by more than 60 digits, the sensor may still perform correctly; however, the factory should be contacted for further guidance.
How can I protect the piezometer from freezing?
Foam plug inserts installed in piezometer tips can significantly reduce the potential for ice damage in freezing conditions (contact the factory for further details).
Applications for Vented Piezometers
As a rule, piezometers that are sealed inside a borehole with bentonite grout or pellets do not need to be vented. The purpose of the vent line is to compensate for barometric fluctuations.
In most cases, barometric pressure changes at the ground surface will never reach a sealed piezometer. It is better to use the non-vented type and, if necessary, record the barometric pressures by some other means. The Barometric pressure is then compared to the piezometer pressure data for correlation between the two. Correlation is normally observed, but the barometric changes seen by the piezometer are nearly always attenuated and, in many cases, suffer a time lag. The compensation, therefore, can be quite complicated.
On the other hand, applications such as open holes, standpipes, wells, etc., where the water surface is in direct contact with the air above, are good candidates for the use of vented piezometers.
Specific Gravity Corrections for a Vibrating Wire Piezometer in Saltwater
Saltwater has a higher density (weight) than freshwater, therefore it exerts more pressure on the vibrating wire piezometer than freshwater. This increased pressure will yield incorrect results if the reading is not adjusted for the specific gravity of saltwater.
The specific gravity of freshwater and saltwater are as follows:
Specific gravity of fresh water = 1
Specific gravity of saltwater = 1.025
Note: The specific gravity of saltwater is the ratio of saltwater/freshwater ![]()
GEOKON calibration sheets typically give kPa/digit and psi/digit gauge factors.
To correct for the specific gravity of salt water, the kPa/psi reading is converted to the desired engineering unit (e.g., feet or meters of water), then divided by the specific gravity of saltwater.
The example below uses a psi gauge factor and an engineering unit of feet of water (PSI to FT = multiplier of 2.31).
Freshwater @50psi measured = (50psi x 2.31) / 1 = 115.5 ft (head of water)
Saltwater @50psi measured = (50psi x 2.31) / 1.025 = 112.68 ft (head of water)
In the above example, the reading provided by the piezometer would show 115.5 feet; however, once the calculations are performed using the specific gravity of saltwater, the actual head of water is determined to be 112.68 feet.
This conversion could be performed at the gauge factor level, but the weight of the material per cubic foot would need to be known. It is easier to take a specific gravity measurement of the liquid and perform corrections at the pressure level.
Batch Calibrated vs Individually Calibrated Strain Gauges
Standard GEOKON strain gauges are batch calibrated.
A controlled number of sample gauges from each production batch are tested for accuracy, linearity, and repeatability. These samples are used to derive an average gauge factor for the entire batch. The accuracy of this method is ±0.5% of the full-scale reading, which is sufficient for most applications. A batch calibration report with easy-to-implement calculations is provided with each order.
For applications where the maximum accuracy is desired, strain gauges can be individually calibrated.
Each gauge is tested for accuracy, linearity, and repeatability in a controlled laboratory setting. This method precisely characterizes the relationship between applied strain and gauge output. Individually calibrated strain gauges have an accuracy of ±0.1% of the full-scale reading. A calibration report with detailed test results and gauge-specific linear and polynomial equations is provided for each gauge.
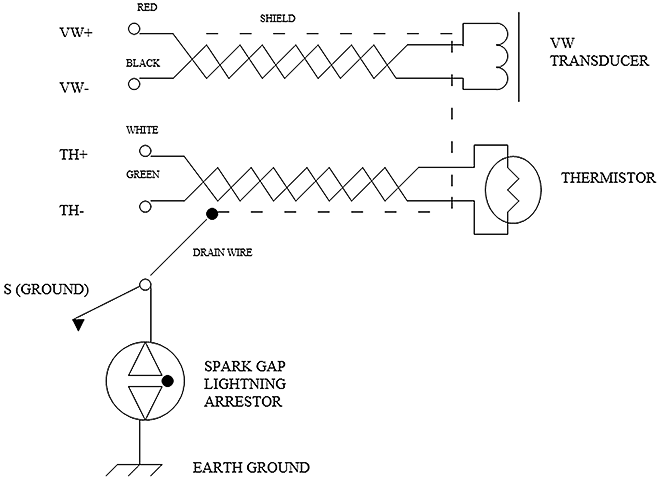
Cable Shielding and Grounding
The GEOKON vibrating wire (VW) transducer is typically excited with a 5Vpk square wave, and the return VW signal is a sine wave in the millivolt range.
Because the excitation signal is rich in harmonics (extending into the radio frequency spectrum), and the return VW signal is both low amplitude and feeds directly into a single-ended high impedance input, electromagnetic noise may easily escape from or be coupled into the transducer cable. Therefore, high quality shielded cable shielding is essential.
When excitation occurs, an unshielded (or poorly shielded) cable can broadcast RF harmonics and interfere with proper operation of neighboring equipment.
In addition, with an unshielded (or poorly shielded) cable, the VW signal returning from the transducer may be corrupted by noise sources. Some of these noise sources include pump motor drives (especially PWM or PFM), fluorescent lighting, lightning, 50-60Hz wiring, radio transmission and industrial equipment. In a similar fashion, the thermistor signal returned from each VW transducer is susceptible to these same noise sources.
The figure below shows the ideal wiring scheme for a GEOKON VW transducer. Note that the shield drain wire is connected at point S (this is the same as connection S on the GEOKON 4999 series Terminal Boxes). It is important that all shield drain wires are connected to their respective S connections in order for proper grounding (and therefore noise reduction) to be effective. Note also that the shield is isolated from Earth Ground. This is important to prevent an electrical “ground-loop” from occurring should the insulation of the cable break down.
Understanding GeoNet Mesh Radio Networks (Models 8800, 8901, 8903)
A GeoNet Network consists of a certain number of loggers and one gateway.
- Loggers:
- Collect data from sensors (piezometers, strain gauges, etc.)
- Forward the collected data to the gateway
- Relays data from/to other loggers as necessary to reach the gateway
- Gateway:
- Controls the network
- Central collection point for all data
GeoNet operates on a self-healing, mesh radio network.
To create the best radio environment possible, follow these guidelines:
- Always mount GeoNet devices so the antenna is pointing up.
- Create as much clear space around the antenna as possible and remove any nearby obstructions.
- A minimum mounting height of six-feet is recommended.
- Common mounting mistakes include:
- Not enough clear space around the antenna
- Mounting devices horizontally
- Placing the device inside an enclosure
- Metallic objects nearby
- Mounting on mesh fencing or surrounding the device with mesh fencing
GeoNet devices can only communicate with other devices that are set to the same radio channel and are within range of their radio signal.
- All GeoNet devices are set to operate on the same channel at the factory
- Channels only need to be configured if multiple networks will be operating within radio range of one another
GeoNet loggers can communicate with the gateway over greater distances, and work around obstacles, by using other loggers as repeaters.
- Each transmission from logger to logger, or from logger to gateway is known as a “Hop”
- Up to four hops can be made between a logger and the gateway
- The network will automatically find the ideal path between each logger and the gateway
There are two modes of network operation: Deployment mode and Normal mode.
- Deployment Mode:
- Allows Loggers to be quickly added to a network and verified
- Must be used when setting up a network or making changes to the network (adding Loggers, changing batteries, resetting a device, etc.)
- Indicated by the LEDs on the gateway flashing every 10-15 seconds
- Automatically activated when the gateway is powered on
- Active for 60 minutes by default (the deploy period can be changed using Agent software)
- Can be reactivated/reset by pressing the status button on the gateway (may take up to 3 minutes to take effect)
- Though deployment mode can be activated in Agent software, it is best practice to physically press the status button on the gateway
- Normal Mode:
- Less battery usage than Deployment mode
- Default mode of operation when not in Deployment mode
Troubleshooting GeoNet Mesh Networks (Models 8800, 8901, 8903)
No Power:
- Loggers and Local Gateways:
- Check the batteries to make sure they are properly installed
- Replace batteries if they are depleted
- Make sure the power switch is set to the correct battery type: lithium or alkaline
- Cellular Gateways:
- Make sure the AC adaptor or other external power source is connected correctly (Cellular Gateways must have an external power source)
- Make sure the power switch is set to “INT BATTERY” (the EXT BATTERY position is only used for subpolar climates: see the manual for more information)
Logger will not join the network:
- Make sure deployment mode is active (indicated by one or both of the LEDs on the gateway flashing every 10-15 seconds)
- Verify that channel dipswitches inside the logger are set to the same position as the switches inside the gateway
- Cycle the power on the logger while it is in close proximity to the gateway and see if it will join the network
- If a logger will not join the Network after the previous suggestions have been tried, it may be out of sync with the gateway and needs to be reset
- To reset a logger, hold down the status button until the red and green LEDs turn on, then release (NOTE: Press and hold the status button on the logger ONLY, do not do this on the gateway)
Weak radio signal (red and green LEDs flashing), or loss of radio signal when moving logger to its final location:
- Try to improve the radio signal by:
- Mounting the device as high as possible
- Making sure there is plenty of clear space around the antenna
- Removing obstructions from the radio path (clear line of sight is best)
- Moving the logger to a better location (splice additional cable onto the instrument if necessary)
- Adding more loggers to the network to provide alternate radio paths
- If the above suggestions do not correct the problem, a high-gain, directional antenna may be required: contact GEOKON for more information
Agent can’t connect to the Gateway:
- Cellular Gateways:
- Ensure that the gateway is connected to an external power supply and that the power switch is set correctly
- Verify the gateway is connected to the cellular network by pressing the status button and observing a green, or green and red flash on the LED indicators
- Make sure the token entered into Agent software is correct, and that the correct “Cloud Network” has been chosen
- Local Gateways:
- Ensure that the D batteries are properly installed
- Replace batteries if they are depleted
- Make sure the power switch is set to the correct battery type: lithium or alkaline
- Make sure the USB or RS-232 cable is securely connected to the gateway and the PC
- Make sure the address (COM port) entered into Agent software is correct
No Data from a Logger:
- Take a test reading by pressing the status button on the gateway (reading will be available for download within the next 6 minutes, depending on radio cycles and gateway type)
- If necessary, data can be retrieved directly from a logger by following these steps:
- Connect a PC to the USB port
- Create a new network in Agent software
- Enter the COM port the logger is connected to as the Network Address
- Download the data
Logger data is present (e.g., battery voltage or signal strength), but the Vibrating Wire or Thermistor Reading is Missing, Incorrect, or Unstable:
- Verify that the gauge leads are wired correctly (refer to the GeoNet instruction manual for wiring information)
- Multi-channel and addressable loggers stop trying to read empty channels after two attempts; additional attempts occur at the top of every hour (reset the logger to initiate an immediate retry)
- Move any sources of electrical noise away from the transducer cable (generators, motors, arc welding equipment, etc.)
- Check sensor operation with an independent readout, such as a GK-404 or GK-406
GK-404 Readout: Button Functionality
Use the Pos button to change the GK-404 pluck settings.
Each Position setting (A-F) has different preprogrammed parameters that are optimized for certain instruments. Each option also has different scaling and processing characteristics. The table below details the correct position to use with the various models sold by GEOKON.
Pressing the Mode button will select the format of the vibrating wire reading.
The available options are Dg (digits), Hz (hertz), μS (period), and με (microstrain). Only positions C, D, and E support the με microstrain format.
Position and Mode Functions
| Position | A | B | C | D | E | F |
|---|---|---|---|---|---|---|
| GEOKON Model Numbers › | All | 4300BX, 4300NX, 4400, 4500, 4600, 4700, 4800, 4900 | 4000 | 4200 | 4100 | 4300EX |
| Mode 1 › | Dg | µE | Dg | |||
| Units › | Digits | µStrain (ε) | Digits | |||
| Calculation › | F2 × 10-3 | F2 × 10-3 × 4.062 | F2 × 10-3 × 3.304 | F2 × 10-3 × 0.39102 | F2 × 10-3 | |
| Mode 2 › | Hz | |||||
| Units › | Hertz | |||||
| Calculation › | F = Frequency in Hertz | |||||
| Mode 3 › | µS | |||||
| Units › | µSec | |||||
| Calculation › | T = Period (1/F) in µSec | |||||
| Frequency Sweep: (Hz) › | 450-6000 | 1500-3500 | 450-1200 | 1500-3500 | 2500-6000 | |
Please Note: there is no number displayed on screen to indicate which mode the GK-404 is in. The current mode can be determined by observing the unit of measure the gauge reading is displayed in.
Pressing the Cfg button will cause the GK-404 to enter the Configuration Menu.
This menu includes settings for the backlight, contrast, and auto-off. The battery voltage can also be viewed. Use the Pos button to select the various parameters and the Mode button to select each parameter's options. Press Cfg twice at any time to exit the Configuration Menu.
Factory default settings can be restored at any time by pressing and holding the Cfg and Pos buttons when powering up the GK-404. The factory default settings are as follows:
- POSITION: B
- MODE: Dg
- BACKLIGHT: OFF
- CONTRAST: 50%
- POWER-OFF TIME: Five minutes
GK-406 Measurement Display Setup
When reading a sensor, the GK-406 will display Digits and Temperature by default.
- From the main screen select Settings.
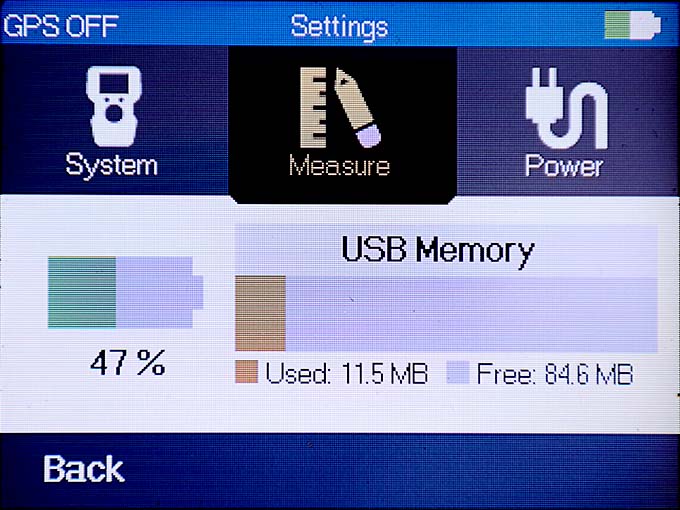
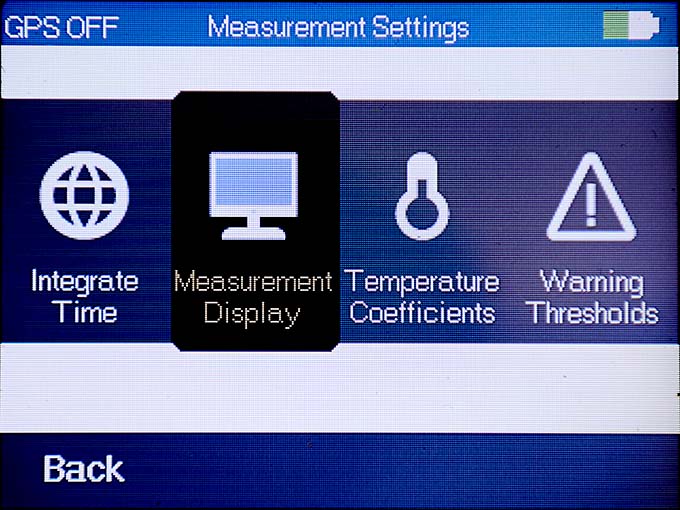
- Select Measure, and then Measurement Display.
- Select the two measurement types to display. The available measurement types are Frequency (Hz), Digits, B Units, Temperature (C/F), Thermistor (Ohms), and Engineering Units. Deselect the Hide Measurement Graph option to display a line graph of the sensor reading in addition to the numeric reading.
- When finished editing the display settings, select Save.
Additional Notes:
- When Engineering Units is selected, the GK-406 will display the calculated units based on the sensor and site selected and will utilize zero readings, gauge factors, and any unit conversions that have been applied. If a sensor or site has not been chosen, or if they are not set up correctly, Undeclared will be displayed.
- When Temperature is selected, the GK-406 will display the calculated temperature value based on the temperature sensor selected in the sensor menu. Failure to select the correct temperature sensor will result in incorrect coefficients being applied. (The GK-406 allows the user to add custom thermistor names and coefficients as needed.)
- The Thermistor (Ohms) setting can be useful in performing resistance readings on thermistors and vibrating wire leads. However, it cannot accurately measure shorts.
Please refer to the GK-406 instruction manual for additional information.
GK-406 Read Function
The Read function on the GK-406 allows the user to quickly take a reading. The reading is not stored, and the sensor settings must be set each time.
- From the main screen, select Read.
- An immediate reading will be taken. The GK-406 displays digits and temperature by default. Each time Read is selected, a new reading will be taken.
- To see additional information about the sensor response, select Details.
- Select Spectrum to display the response of the plucked gauge as a line graph. The graph will also display any noise that may be present in the frequency range. (The frequency sweep is shown in white; blue denotes the area outside the selected range.)
- Select Time to display a time series graph of the signal response decay.
- To make changes to the sensor settings, return to the Read screen and select Options.
Available Options:
- Frequency Sweep: Select the values that correspond to the connected sensor. The frequency range of GEOKON sensors are provided in the sensor instruction manual.
- Excitation: Excitation should be set to 5 volts for most GEOKON sensors. (Use 12 volts for GEOKON Model 4500HT gauges.) If unsure, consult the product manual or contact the factory.
- Thermistor/RTD: Select whether the thermistor is GEOKON standard, GEOKON high temp, or from another manufacturer. (The GK-406 also allows the user to add custom thermistor names and coefficients as needed. Refer to the GK-406 instruction manual for more information.)
- Hide Measurement Graph: Deselect to display a line graph of the sensor reading in addition to the numeric reading.
- Remember Settings: Check to have the GK-406 save the current settings and apply them the next time the Read function is used.
- Select Apply to close the options screen and take a new reading with the updated settings.
Please refer to the GK-406 instruction manual for additional information.
USB Drivers
A USB driver is a file that allows GEOKON dataloggers, readouts, and other hardware devices to communicate with the operating system of a computer.
Installing USB drivers is an essential part of the setup process; if they are not installed correctly the device will not work.
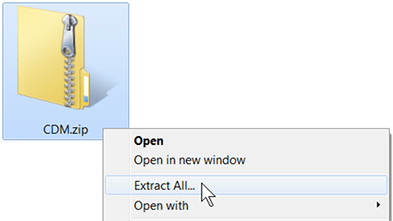
USB drivers for GEOKON devices can be downloaded from www.geokon.com/software. If you have installed the USB drivers but they are not working, the drivers will need to be reinstalled as follows:
- Right click on the CDM.zip folder and then select Extract All…”
- A new window will open. Select a location for the file and then click “Extract”.
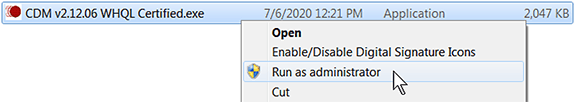
- Locate the extracted CDM file. Right click on the file and then select “Run as Administrator”.
If the USB drivers still don’t work after installing them in this manner, please contact your IT department.
Agent compared to Third-Party Data Acquisiton Software
| Agent | Third-Party Software | |
|---|---|---|
|
GEOKON Agent is a basic data collection and visualization software that makes the tasks of configuring hardware, monitoring sensors, collecting data, managing data files, and applying corrections easier and faster. |
Agent compared to Third-Party Data Acquisiton Software: |
Industry-leading data visualization software platforms have dozens of visualization and analysis tools to help the user understand complex data and make informed decisions. |
| Data Acquisition | ||
| X | Automatic Data Collection | X |
| Edit/Recalibrate Logged Data | X | |
| Add Manually Taken Readings | X | |
| Remove Data Noise by eliminating random disturbance in sensor readings | X | |
| X | Export Data Files | X |
| X | Populate Calibration Factors Automatically from GEOKON calibration database (Not available for all sensors) | |
| X | Converts Raw Data to Engineering Units | X |
| X | Perform Powerful Math Calculations | X |
| Visualization and Analysis | ||
| X | Display Numerical Data in Versatile Tables | X |
| X | Customizable Trendline Graphs | X |
| Custom Dashboards | X | |
| Overlay real-time data on an image, webcam, or GIS map | X | |
| Contour Plotting displays measurement distribution over a given location | X | |
| Over 30 Visualizations and Analysis Tools | X | |
| Reports, Alerts, and Collaboration | ||
| Create, Design, and Schedule Reports for daily, weekly, or monthly delivery | X | |
| X | Visual and Audio Alarms for out of rangedata and sensor malfunction | X |
| Manage Stakeholder Access to Features and Data with fine-grained user roles | X | |
| Customizable Interface and Login Page can display user’s brand logo and colors | X | |
