Loading... Please wait...
-
Products
- Piezometers
- Inclinometers
- Strain Gauges
- Data Loggers
- Time Domain Reflectometry (TDR)
- Displacement Transducers
- Extensometers
- Settlement Sensors
- Pressure Cells
- Load Cells
- Tiltmeters · Pendulums
- Readouts
- Visualization Software
- Stressmeters
- Distributed Fiber Optic Sensors
- Temperature
- Instrumentation Cables
- DeAerators
- Vibration Monitoring
- Custom Instrumentation
- Discontinued
- Support
- Training
- Contact Us
- News
- Company
- Projects
- Resources
- Videos
- Links
Resources
Session 06
Manual Inclinometer Probe · Data Interpretation Guide
Posted July 10, 2026
A manual inclinometer probe is one of the most widely used instruments in geotechnical monitoring — yet the path from raw readings to meaningful displacement data is often misunderstood.
This guide walks through the fundamental concepts of what an inclinometer measures, how those measurements are processed, and how to read the two most common output plots.

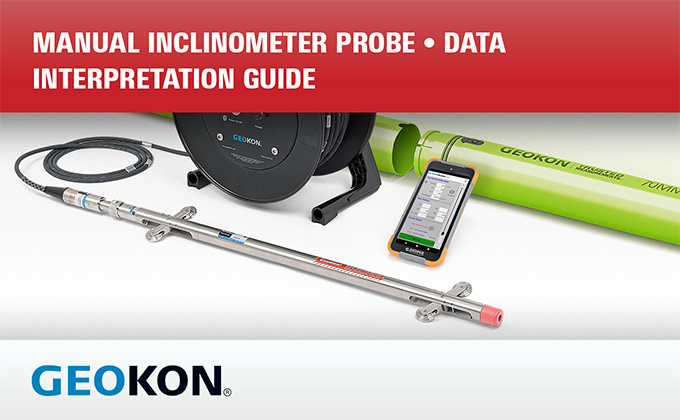
The lowering of a manual inclinometer probe into grooved casing installed in a borehole.
What Does an Inclinometer Read?
A manual inclinometer probe works by lowering a biaxial sensor probe through a grooved casing installed in a borehole. As the probe is pulled upward at fixed intervals, it records the tilt angle of the casing at each depth. These angles, taken together, build a picture of the casing's shape along its entire length.
Each angle reading represents the inclination of the casing at a single depth. This inclination can be converted to displacement, resulting in the horizontal displacement profile along the casing in two orthogonal directions.
Sensor Orientation and the Meaning of A+ and B+
Before any meaningful interpretation can take place, it is essential to understand the inclinometer's axes and their relationship to the casing.
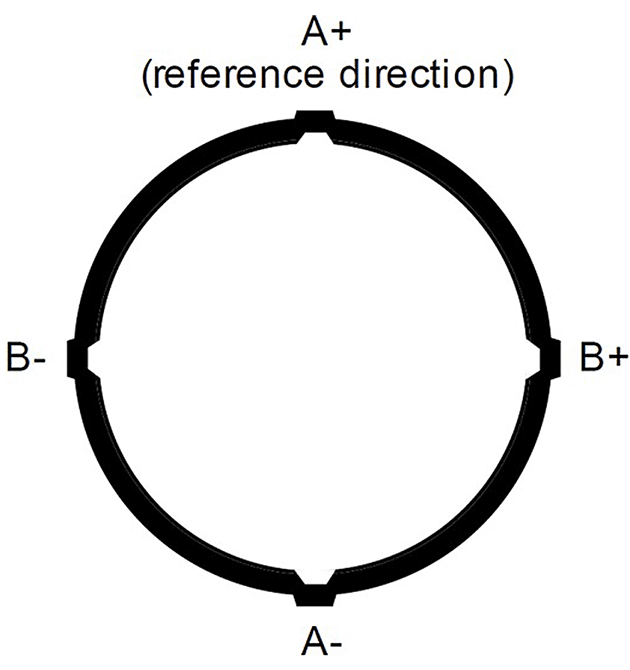
The probe measures tilt in two orthogonal directions, referred to as the A-axis and the B-axis. Each axis has a positive and a negative direction of tilt. The wheels of the probe are aligned with the A-axis measurement. During a survey, the probe wheels ride in grooves inside the casing, thus, the grooves of the casing directly correspond to the axes of the probe and the direction of tilt being measured. The probe must be inserted into the casing in the same orientation for each survey taken.
Best practice is to orient the casing during installation so that one groove faces the anticipated direction of movement — for example, the downslope direction in a slope stability application or the excavation side in a retaining wall monitoring program.
Once the casing is in place, each survey should begin by inserting the probe with its A+ wheels in the groove facing the anticipated direction of movement. When this convention is followed, positive A readings directly indicate movement toward the area of concern, making data interpretation more intuitive and reducing the chance of a sign error. In this scenario, readings are interpreted as:
- A+: movement toward the anticipated direction
- A−: movement in the opposite direction
- B+ and B− follow the same logic for the orthogonal axis
Note: If the casing orientation is not documented at installation, subsequent data interpretation becomes significantly more difficult.
Establishing a Baseline
Because no borehole is perfectly vertical and no casing is installed without some initial inclination, raw readings from any single survey campaign are not useful by themselves. All displacement calculations are relative to an initial reference measurement known as the baseline.
The baseline represents the casing's initial geometry at the start of the monitoring program, before any ground movement of interest has occurred. All subsequent surveys are compared against the baseline. The difference between a later reading and the baseline reading at each depth represents how much the casing has deformed over that period.
The corrected tilt angle at each depth for any given survey is therefore:
θcorrected = θcurrent − θbaseline
Selecting a good baseline is critical. A baseline taken during or immediately after installation may still reflect drilling disturbance, casing settlement, or grout curing effects. For this reason, it is strongly recommended to collect at least three independent survey readings before selecting a baseline. Reviewing these early readings for consistency — and discarding any that appear anomalous — gives confidence that the chosen baseline reflects the true undisturbed geometry of the casing.
Calculating Displacement
Once the corrected tilt angle at each depth has been determined, it can be converted into horizontal displacement using a simple trigonometric relationship:
D = L ⨯ sin(θcorrected)
Where:
D = Horizontal displacement over the sensor segment
L = Gauge length of the sensor segment
θcorrected = Tilt corrected at each depth
This calculation is performed at each depth interval along the casing, giving a displacement value for each segment.
Graph visualization
Displacement values calculated at each depth interval are typically presented in two standard plot types.
Incremental Displacement
The incremental displacement plot displays the displacement contribution of each individual segment at each monitoring date, compared to the baseline.
On a typical incremental displacement graph:
- Horizontal axis: displacement (mm or inches)
- Vertical axis: depth
- Each line: one monitoring date
- Each point: one measurement depth
The incremental displacement plot is particularly useful for identifying where the casing movement is concentrated. A segment that is tilting progressively more with each survey will appear as a cluster of lines that grow wider at that depth. Sudden spikes or anomalous offsets at a particular depth often signal the location of a shear zone or discontinuity.
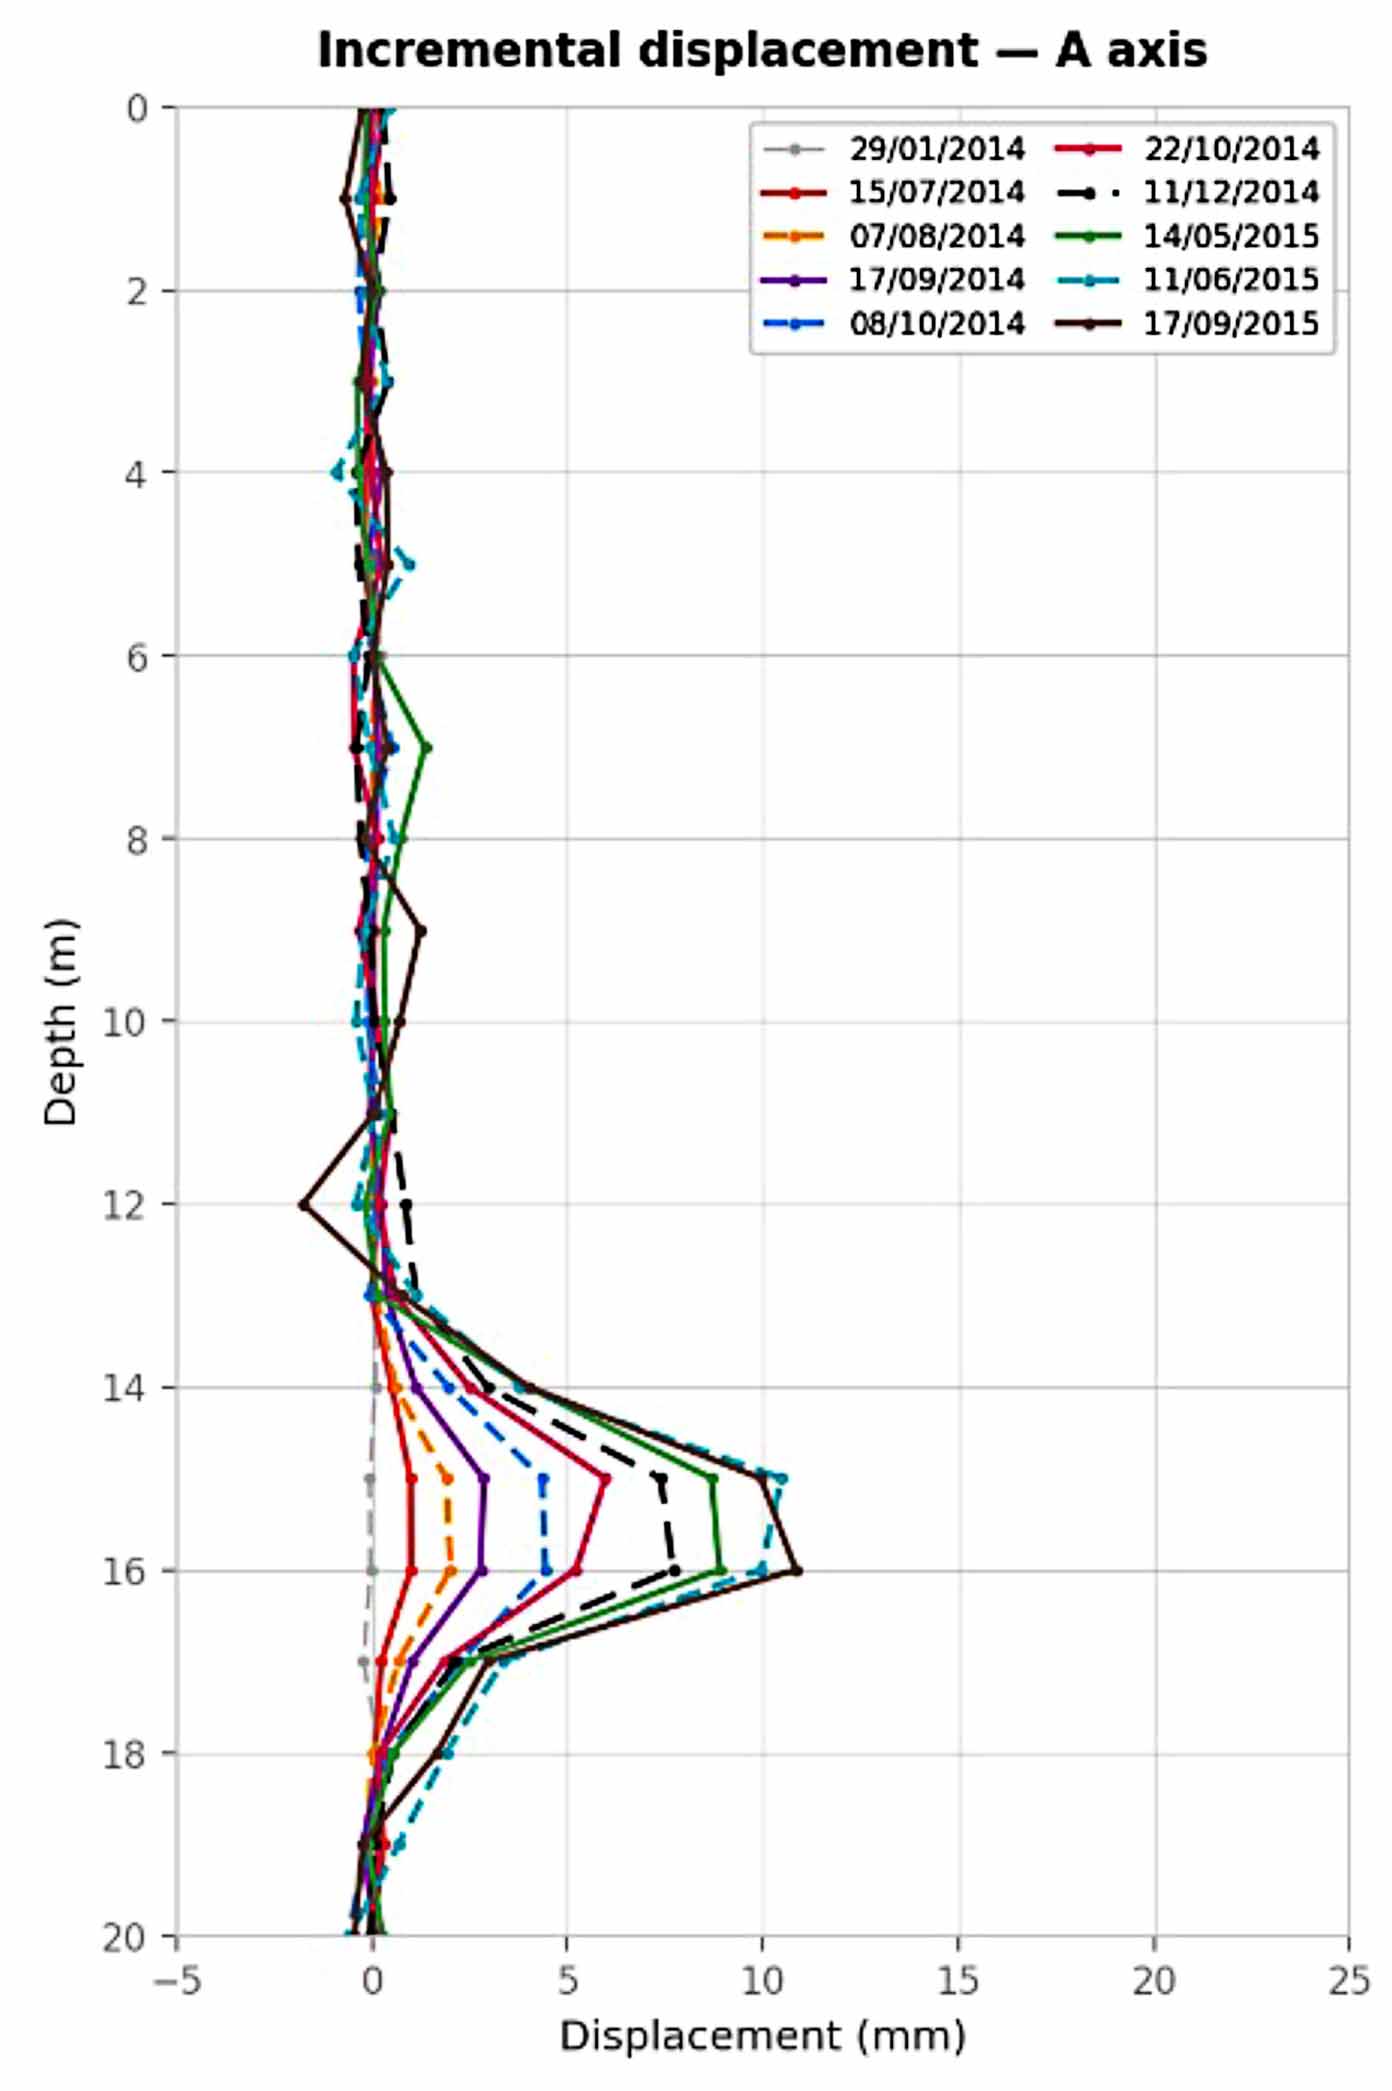
An incremental displacement plot, useful for identifying where casing movement is concentrated.
Cumulative Displacement
The cumulative displacement plot shows the total horizontal displacement at each depth, calculated by summing the incremental displacements from the bottom of the casing upward. The bottom of the casing is assumed to be anchored in stable material below any zone of movement and is treated as a fixed reference point with zero displacement.
Summing upward from this fixed base, each successive depth interval adds its increment, so the cumulative displacement at the top of the casing reflects the total relative movement of the casing head with respect to the bottom.
The cumulative displacement plot is most effective for visualizing the overall shape of the deforming casing and for identifying the depth of a shear zone
The cumulative displacement at each depth z is:
CDz = ∑Di
Where:
CDz = Cumulative displacement at depth z
Di = Incremental displacement at segment i
∑ = Sum of all incremental displacements from the bottom of the casing up to depth z
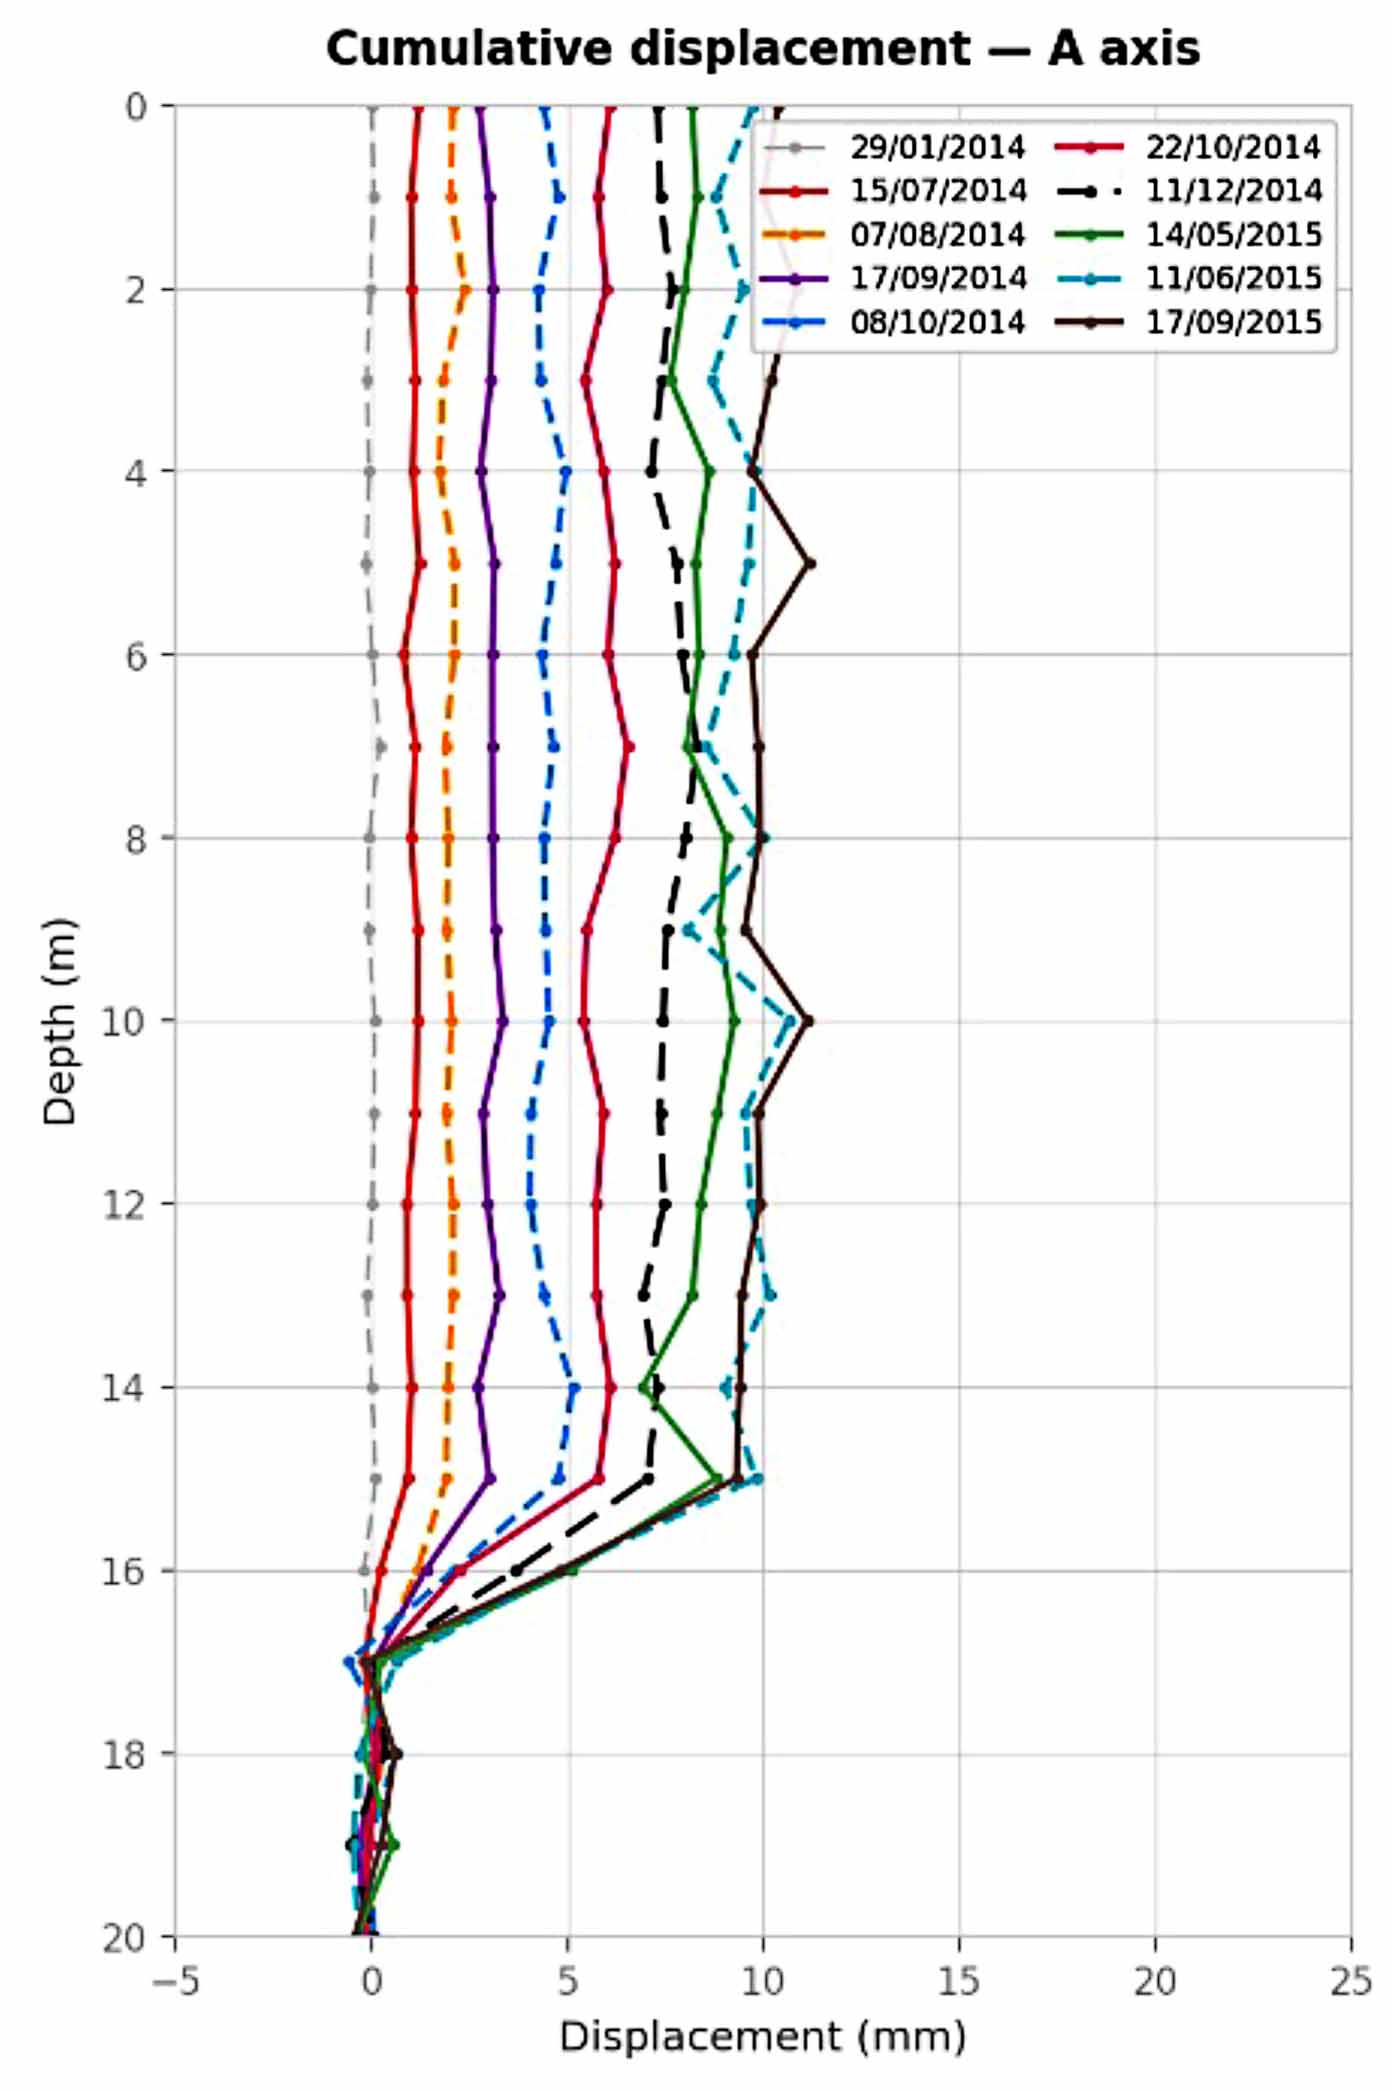
A cumulative displacement plot shows the total horizontal displacement at each depth.
Practical Notes for Data Review
A few additional points are worth keeping in mind when reviewing inclinometer data:
Check Both Axes
Movement is rarely perfectly aligned with the A-axis. Reviewing the B-axis data alongside the A-axis can reveal oblique movement directions.
Look for Repeatability, Not Just Magnitude
A single survey with an unexpected displacement spike may reflect a data quality issue rather than actual movement. Consistent trends across multiple survey dates are much more meaningful than any single reading.
Watch the Base
If the base of the casing is moving because the borehole was not drilled deep enough to anchor below the zone of movement, all cumulative displacement calculations will be underestimated.